NSW Assault Statistics 2025
The NSW Bureau of Crime Statistics and Research (BOCSAR) reports that non-alcohol-related assaults across New South Wales have remained largely stable over the two years to June 2025. However, rates vary significantly between regions, reflecting differences in population density, urban design, and socio-economic factors.
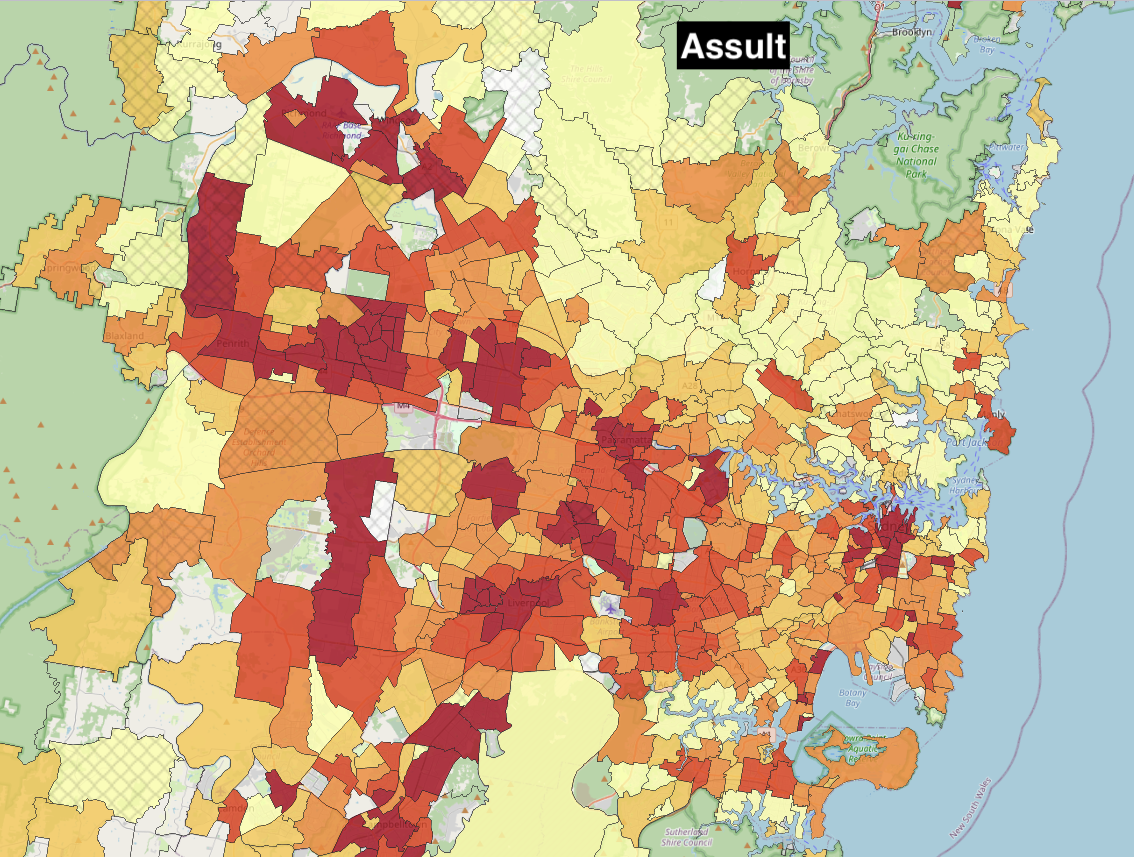
The Baulkham Hills, Hornsby, and Northern Beaches regions continue to record some of the lowest assault rates in the state, reinforcing their status as secure and desirable residential locations. These areas benefit from strong community engagement, higher household incomes, and effective local policing.
By contrast, elevated assault rates are observed in Blacktown, Parramatta, and the Outer West, where denser populations and nightlife activity contribute to higher incident counts. Despite these figures, overall trends remain stable statewide, suggesting NSW’s long-term crime management policies are maintaining consistent outcomes.
For homebuyers and investors, low assault rates are a strong indicator of social stability and community safety — factors that underpin long-term property growth and sustained rental demand. The following table provides a regional breakdown of assault rates across NSW, covering the period from July 2023 to June 2025.
| SA4 | Trend: 2 year | Count | Rate |
|---|---|---|---|
| New South Wales | Stable | 58182 | 697.4 |
| Sydney - Inner South West | Stable | 3712 | 595.4 |
| Sydney - Blacktown | Up 5.5% per year | 3654 | 848.7 |
| Sydney - Parramatta | Stable | 3607 | 700.5 |
| Sydney - South West | Stable | 3601 | 717.2 |
| Sydney - City and Inner South | Stable | 3481 | 977.3 |
| Newcastle and Lake Macquarie | Up 7.2% per year | 3107 | 773.1 |
| Central Coast | Stable | 2828 | 803.6 |
| Hunter Valley exc Newcastle | Stable | 2685 | 880.0 |
| New England and North West | Stable | 2605 | 1375.9 |
| Sydney - Outer West and Blue Mountains | Stable | 2563 | 751.2 |
| Sydney - Outer South West | Stable | 2291 | 735.8 |
| Far West and Orana | Down 10.6% per year | 2136 | 1811.7 |
| Mid North Coast | Stable | 2071 | 884.0 |
| Central West | Up 4.0% per year | 2064 | 960.7 |
| Richmond - Tweed | Stable | 1716 | 658.9 |
| Illawarra | Stable | 1670 | 518.9 |
| Riverina | Stable | 1495 | 904.8 |
| Coffs Harbour - Grafton | Stable | 1471 | 987.0 |
| Sydney - Inner West | Stable | 1433 | 455.2 |
| Capital Region | Stable | 1272 | 523.3 |
| Sydney - Eastern Suburbs | Down 4.5% per year | 1176 | 430.6 |
| Murray | Stable | 1122 | 890.4 |
| Sydney - North Sydney and Hornsby | Stable | 1113 | 254.5 |
| Sydney - Sutherland | Up 25.7% per year | 967 | 412.4 |
| Southern Highlands and Shoalhaven | Stable | 956 | 587.3 |
| Sydney - Northern Beaches | Stable | 683 | 254.9 |
| Sydney - Baulkham Hills and Hawkesbury | Stable | 651 | 232.4 |
| Sydney - Ryde | Stable | 649 | 307.5 |